


Designed for Options Traders
IV Watchlist is a specialized software application designed for US options traders.
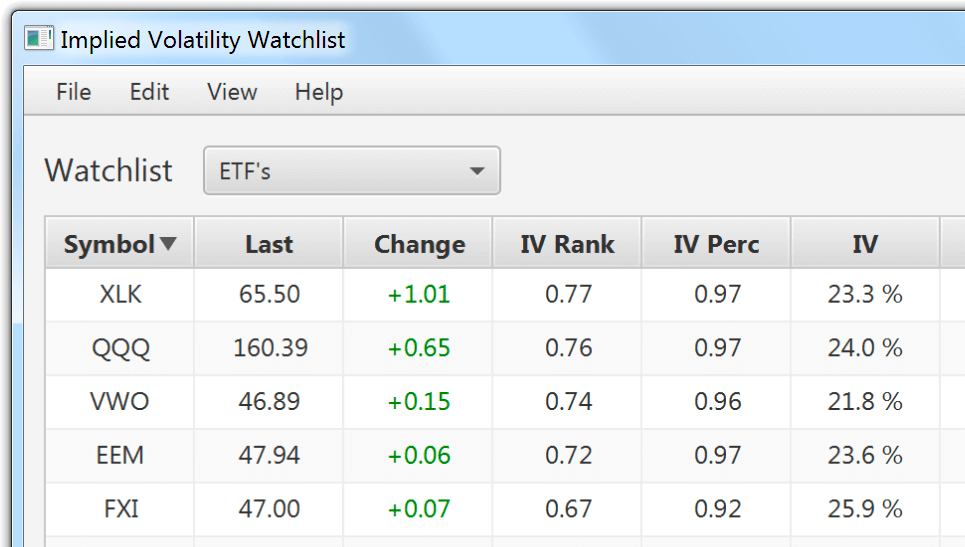
It provides a range of implied volatility related data for stocks/ETF’s such as IV Rank, IV Percentile, IV Change etc.
It connects to Interactive Brokers Trader Workstation (TWS) and runs on either Windows or Mac OSX.

IV Rank & IV Percentile
IV Rank and IV Percentile are typically used by options traders to detect significant increases in implied volatility that may signal an opportunity to sell option premium e.g. short put, short strangle, vertical credit spread etc.
IV Rank measures the current implied volatility of an underlying instrument (e.g stock or ETF) relative to it’s IV range over the past 12 months. Values above 0.50 signify higher volatility.
IV Percentile measures the percentage of time, over the past 12 months, that implied volatility is below the current implied volatility level. High IV Percentile values signify higher volatility.
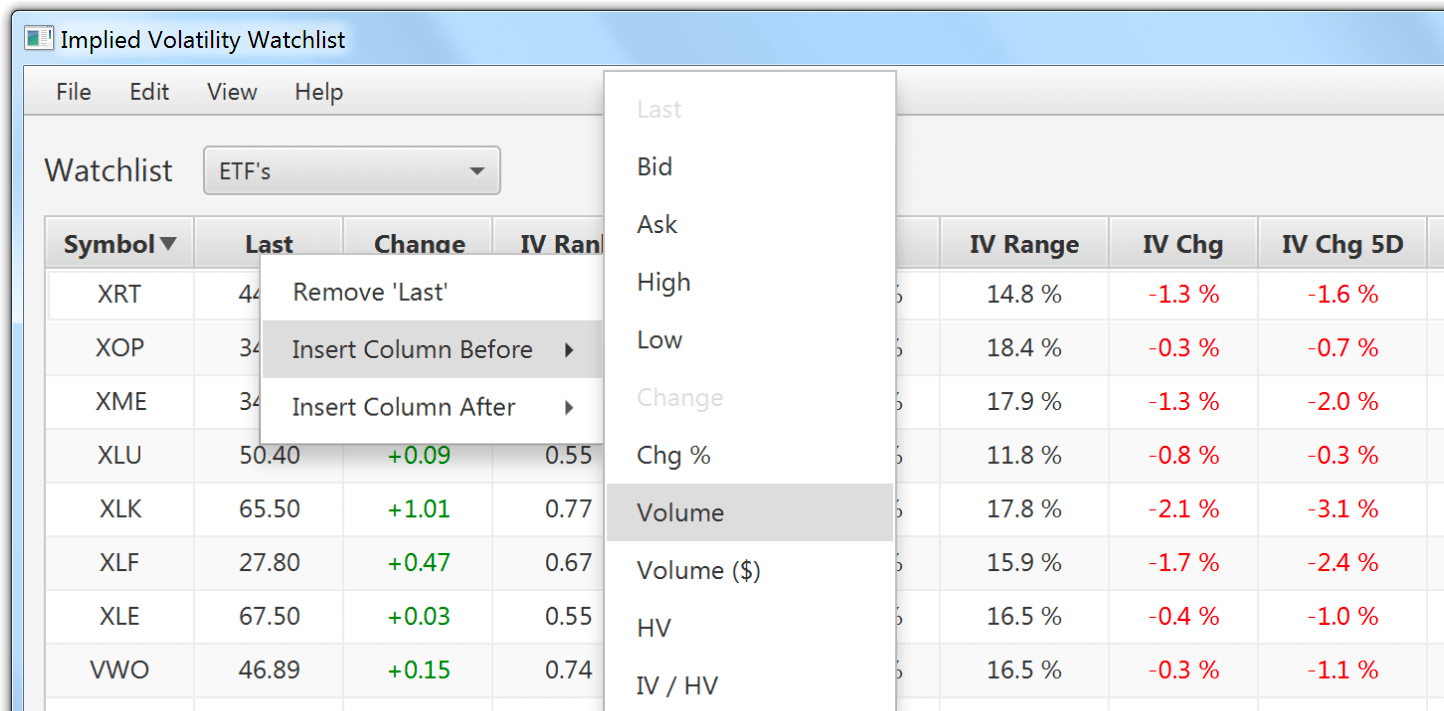
Highly Customizable
Customize the watchlist layout to fit your specific needs.
Choose from more than 20 different watchlist data columns types. e.g IV change, IV Range, IV Rank, Historic Volatility, IV Percentile, Volume, Days Until Earnings etc.
Watchlist columns can be easily moved, added, deleted, resized or sorted.

Easy to use Watchlist groups
Group related instruments into custom watchlist groups (e.g. ETF’s, Financials, etc).
Watchlist groups can easily be added, deleted, or renamed.
Organize your custom watchlists by moving or copying instruments to other watchlist groups.

Implied Volatility Charting
Display an IV chart for any instrument in the watchlist with a simple right-click.
Charts display 12 months of IV Data. Select multiple instruments to compare IV on the same chart.
IV charts are useful for timing trade entry and exit, and understanding the past impact of binary events e.g. company earnings.

Probability Table
This feature calculates in-the-money (ITM) and out-of-the-money (OTM) probability at various strike levels, based on the expiry date, current price and implied volatility.
This data is useful when choosing a strike price for a short option trade.
By default, probability calculations are performed using the current IV.
The IV can be adjusted to a hypothetical value (e.g. yearly high IV), to determine the impact on probability values as implied volatility changes.

Earnings Date & Days Until Earnings*
These watchlist fields display the date and number of days until the company’s next earnings announcement.
A company’s earnings date is an important binary event to be aware of when planning an option trade.
That’s because there’ll generally be a large increase in implied volatility leading up an earnings announcement, followed by potentially extreme price moves and a sudden contraction in volatility after the earnings number is released.

*Note: This feature requires an active subscription to Interactive Brokers Wall Street Horizon news feed.